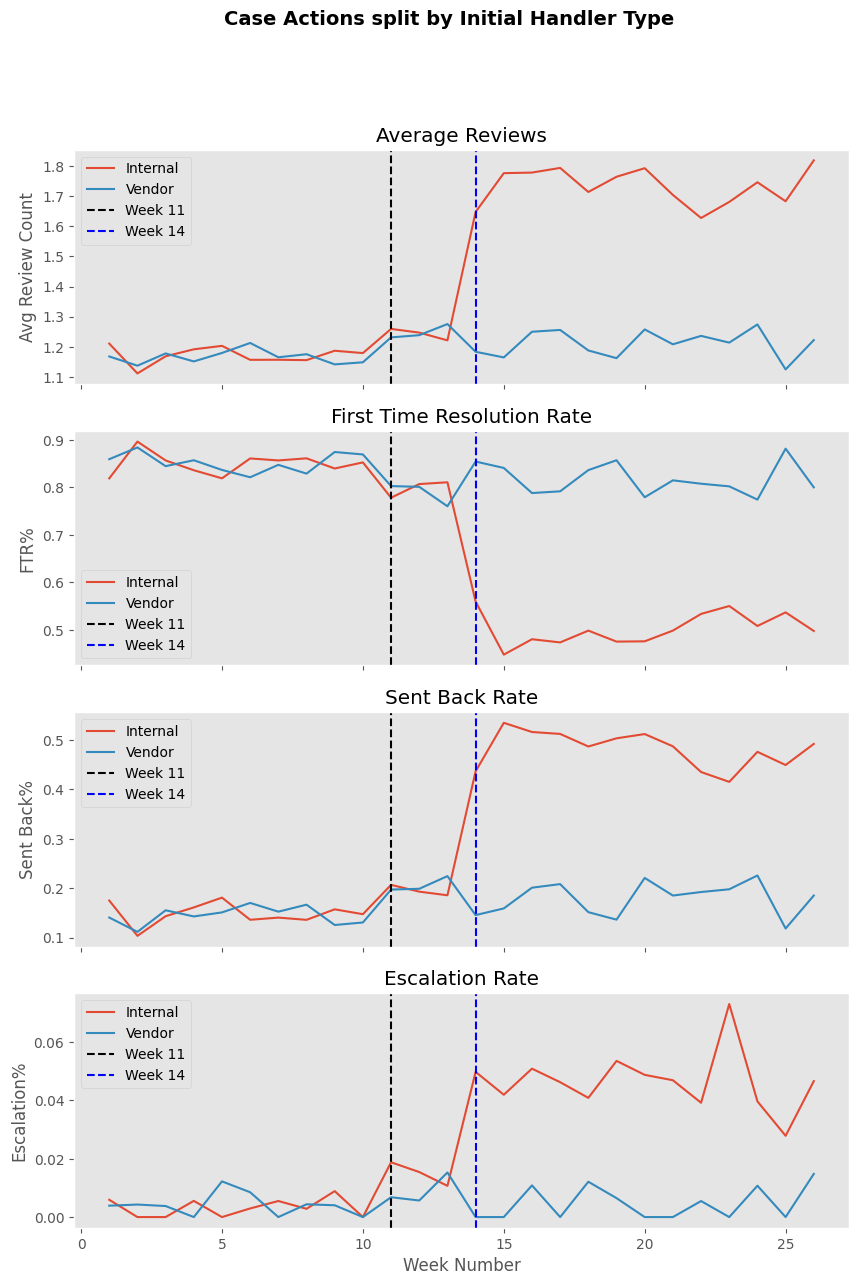
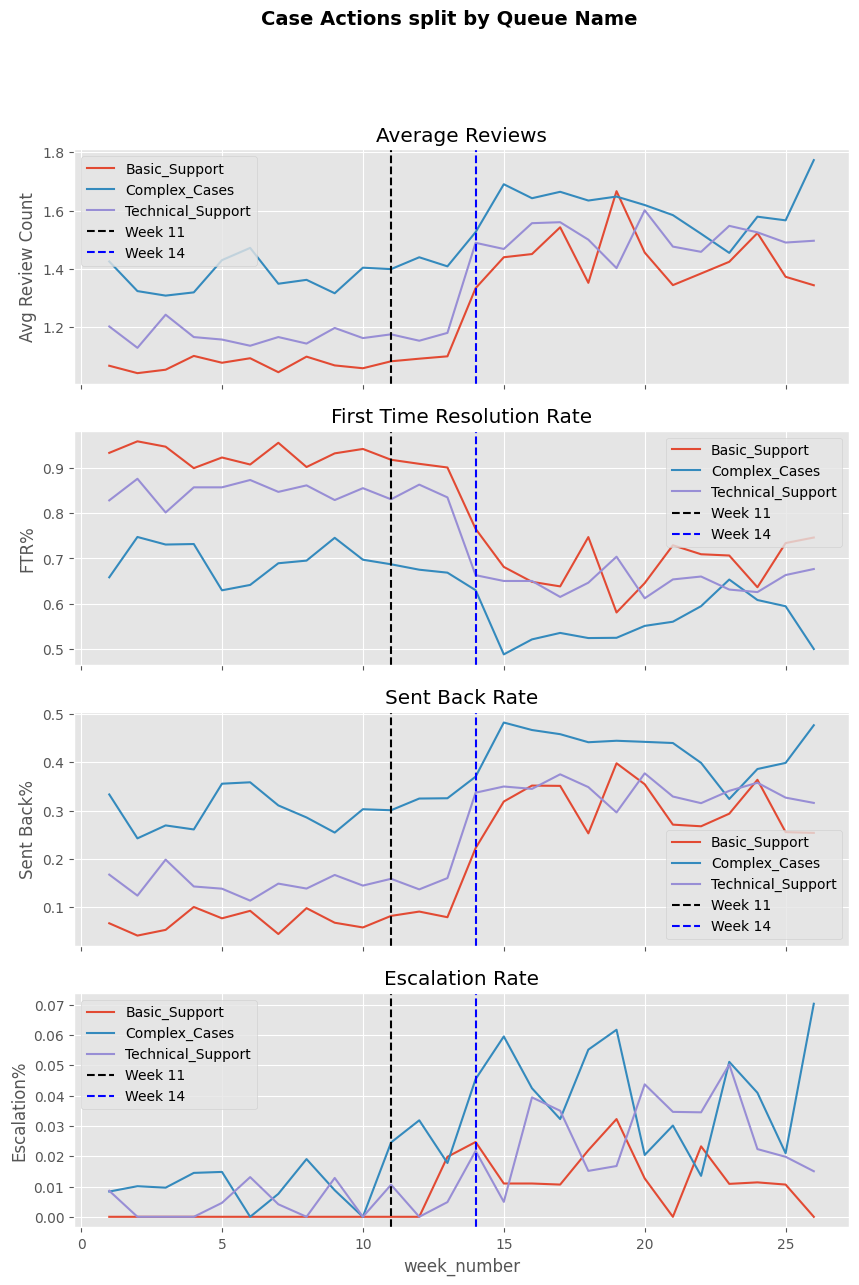
The SLA analysis established that performance had declined and when it happened. This section examines why - specifically whether the routing change introduced operational friction in the form of more reviews per case, higher sent-back rates, and more escalations. We review the below metrics in this section.
Key metrics:
num_reviews — total touches per case. Values > 1 indicate rework.
had_sent_back — case was returned to queue at least once. This could means a case was routed to an agent who couldn’t or shouldn’t resolve it, and they pushed it back.
had_escalation — case required a more senior decision. Rising escalation rates suggest agents are receiving cases that exceed their authority or skill level.
first_time_resolution_rate — % of cases resolved on the first review calculated as (all cases where num_reviews = 1) / (all cases)
Setup and Data Prep
Code
# Import librariesimport numpy as npimport pandas as pdimport matplotlib.pyplot as pltimport warningswarnings.filterwarnings("ignore")# Set plt styleplt.style.use("ggplot")# Load the operations cases and reviews dataops_cases_df = pd.read_csv("ops_cases.csv")ops_reviews_df = pd.read_csv("ops_reviews.csv")# Set the period order for the dataperiod_order = ["Baseline", "Self-serve Only", "Both Changes"]ops_cases_df["period"] = pd.Categorical( ops_cases_df["period"], categories=period_order, ordered=True)
Code
# Merge cases and reviews table to bring in week_number and periodops_reviews_df = ops_reviews_df.merge( ops_cases_df[["case_id", "week_number", "period", "initial_handler_type"]], on="case_id", how="left",)# Convert date columns into correct formatsops_reviews_df["actual_start_at"] = pd.to_datetime(ops_reviews_df["actual_start_at"])ops_reviews_df["intended_start_at"] = pd.to_datetime( ops_reviews_df["intended_start_at"])ops_reviews_df["end_at"] = pd.to_datetime(ops_reviews_df["end_at"])# Add a new weekly column in the reviews data based on the intended start at dateops_reviews_df["week_number_new"] = ( pd.to_datetime(ops_reviews_df["intended_start_at"])- pd.to_datetime(ops_reviews_df["intended_start_at"]).min()).dt.days //7+1# Add a new period column based on the week_numberops_reviews_df["period_new"] = ops_reviews_df["week_number_new"].apply(lambda x: ("Baseline"if x <=10else ("Both Changes"if x >13else"Self-serve Only") ))ops_reviews_df["period_new"] = pd.Categorical( ops_reviews_df["period_new"], categories=period_order, ordered=True)
First resolution Rate
Add the column for first resolution
Code
# First resolution metric createdops_cases_df["first_attempt_resolve"] = ops_cases_df["num_reviews"].apply(lambda x: Trueif x ==1elseFalse)
1. Friction Metrics by Period and Handler Type
Are the case review/escalation metrics creating some sort of a friction in case closure and is the first time resolution getting impacted?
Code
# Average num_reviews, escalation rate, sent_back rate by period and handler typeops_cases_df.groupby(["period", "initial_handler_type"]).agg( avg_reviews=("num_reviews", "mean"), first_time_resolution_rate=("first_attempt_resolve", "mean"), escalation_rate=("had_escalation", "mean"), sent_back_rate=("had_sent_back", "mean"), avg_resolution_hours=("resolution_hours", "mean"),).round(3)
Analyze the outcomes for each review and how they change over time
Code
# Add columns to review data for similar analysisops_reviews_df["had_escalation"] = ops_reviews_df["outcome"].apply(lambda x: Trueif x =="Escalated"elseFalse)ops_reviews_df["had_sent_back"] = ops_reviews_df["outcome"].apply(lambda x: Trueif x =="Sent Back"elseFalse)# First resolution Rateops_reviews_df["first_attempt_resolve"] =Falseops_reviews_df.loc[ (ops_reviews_df["review_order"] ==1) & (ops_reviews_df["outcome"] =="Completed"),"first_attempt_resolve",] =True
Split by Handler Type
Code
# Average num_reviews, escalation rate, sent_back rate by period and handler typeops_reviews_df.groupby(["period_new", "handler_type"]).agg( first_time_resolution=("first_attempt_resolve", "mean"), escalation_rate=("had_escalation", "mean"), sent_back_rate=("had_sent_back", "mean"),).round(3)
first_time_resolution
escalation_rate
sent_back_rate
period_new
handler_type
Baseline
Internal
0.729
0.003
0.143
Vendor
0.733
0.004
0.138
Self-serve Only
Internal
0.643
0.012
0.185
Vendor
0.633
0.008
0.195
Both Changes
Internal
0.289
0.028
0.394
Vendor
0.670
0.004
0.171
Split by Queue Name
Code
# Average num_reviews, escalation rate, sent_back rate by period and queue_typeops_reviews_df.groupby(["period", "queue_name"]).agg( first_time_resolution=("first_attempt_resolve", "mean"), escalation_rate=("had_escalation", "mean"), sent_back_rate=("had_sent_back", "mean"),).round(3)
first_time_resolution
escalation_rate
sent_back_rate
period
queue_name
Baseline
Basic_Support
0.869
0.000
0.065
Complex_Cases
0.509
0.007
0.261
Technical_Support
0.724
0.004
0.142
Self-serve Only
Basic_Support
0.848
0.007
0.069
Complex_Cases
0.482
0.015
0.278
Technical_Support
0.730
0.003
0.138
Both Changes
Basic_Support
0.481
0.010
0.293
Complex_Cases
0.351
0.027
0.349
Technical_Support
0.435
0.019
0.314
Basic Sent Back Rate
Check whether the basic sent back cases were sent back in the first attempt itself and was it primarily by internal teams.
Code
# Average num_reviews, escalation rate, sent_back rate by period and queue_typeops_reviews_df[ops_reviews_df["queue_name"] =="Basic_Support"].groupby( ["period", "handler_type"]).agg( first_time_resolution=("first_attempt_resolve", "mean"), escalation_rate=("had_escalation", "mean"), sent_back_rate=("had_sent_back", "mean"),).round(3)
first_time_resolution
escalation_rate
sent_back_rate
period
handler_type
Baseline
Internal
0.867
0.000
0.066
Vendor
0.873
0.000
0.064
Self-serve Only
Internal
0.844
0.006
0.072
Vendor
0.852
0.008
0.066
Both Changes
Internal
0.312
0.014
0.392
Vendor
0.872
0.000
0.064
Basic Support Internal Sent back rates/escalations/first_time_resolutions went up from 6.6% to 39% while vendor remained stable.
Code
# How many of them were on the first attempt itselftotal_reviews_baseline = ops_reviews_df[ (ops_reviews_df["period"] =="Baseline")& (ops_reviews_df["handler_type"] =="Internal")].shape[0]total_sent_backs_baseline_first_attempt = ops_reviews_df[ (ops_reviews_df["period"] =="Baseline")& (ops_reviews_df["handler_type"] =="Internal")& (ops_reviews_df["review_order"] ==1)& (ops_reviews_df["outcome"] =="Sent Back")].shape[0]total_sent_backs_both_changes_first_attempt = ops_reviews_df[ (ops_reviews_df["period"] =="Both Changes")& (ops_reviews_df["handler_type"] =="Internal")& (ops_reviews_df["review_order"] ==1)& (ops_reviews_df["outcome"] =="Sent Back")].shape[0]print(round(total_sent_backs_baseline_first_attempt / total_reviews_baseline, 2))print(round(total_sent_backs_both_changes_first_attempt / total_reviews_baseline, 2))
0.12
0.41
Code
# How many of them were on the first attempt itself (Vendor)total_reviews_baseline = ops_reviews_df[ (ops_reviews_df["period"] =="Baseline")& (ops_reviews_df["handler_type"] =="Vendor")].shape[0]total_sent_backs_baseline_first_attempt = ops_reviews_df[ (ops_reviews_df["period"] =="Baseline")& (ops_reviews_df["handler_type"] =="Vendor")& (ops_reviews_df["review_order"] ==1)& (ops_reviews_df["outcome"] =="Sent Back")].shape[0]total_sent_backs_both_changes_first_attempt = ops_reviews_df[ (ops_reviews_df["period"] =="Both Changes")& (ops_reviews_df["handler_type"] =="Vendor")& (ops_reviews_df["review_order"] ==1)& (ops_reviews_df["outcome"] =="Sent Back")].shape[0]print(round(total_sent_backs_baseline_first_attempt / total_reviews_baseline, 2))print(round(total_sent_backs_both_changes_first_attempt / total_reviews_baseline, 2))
During the baseline period, internal and vendor friction metrics were virtually identical - avg reviews ~1.17, sent-back rate ~14.6%, resolution hours ~33–35 hours. This symmetry confirms that the two groups were operationally comparable before any intervention.
After both changes, internal teams diverged sharply from vendor teams. Internal sent-back rate rose from 14.6% to 47.8% — a 33pp increase. Vendor sent-back rate rose only 3.7pp over the same period. Internal avg reviews per case rose from 1.17 → 1.72 while vendor remained roughly same.
Basic_Support shows the most dramatic sent-back deterioration, rising from 7% at baseline to 30.4% after both changes (a 4x increase for a queue that previously had the lowest friction of all three). This is counterintuitive: the simplest queue became the most operationally broken after routing was applied.
The sent-back explosion is not explained by self-serve alone. During the self-serve only period, sent-back rates barely moved for any group. The step-change happens precisely at Week 14, pointing to routing as the direct probable cause.
Escalation rates, while smaller in absolute terms, show the same pattern — rising sharply for internal teams after Week 14 while vendor rates remain near zero. This suggests agents are not only bouncing cases back but also pushing decisions upward when they receive cases that exceed their confidence or authority. Another important aspect is that the escalation rates increased even more for complex cases than any other.
Internal first-time resolution rate for reviews collapsed from ~73% to ~30% after Week 14, while vendor first-time resolution held at ~65–70%. This is the review-level confirmation that routing is sending cases to agents who cannot resolve them on first contact. This is not just occasionally, but in ~70% of cases by the Both Changes period. At a case level, this drop was ~85% to ~51%.
Review-level sent-back rates mirror the case-level findings: Internal review sent-back rate rose from 14.3% to 39.3% post Week 14. Vendor went from 13.9% to 17.1%.
The bottleneck is rework and not initial queue wait: Average wait time to first touch (ASA) fell for internal teams after Week 14 - from 29.7 hours to 17.3 hours. This rules out understaffing or slow assignment as the primary problem. Cases were being assigned faster but to the agents who couldn’t resolve them, triggering send-backs and additional touches that consumed SLA time.
This is an operational distinction in terms of recommendations: The problem is routing accuracy and handoff design, not headcount or speed of assignment. Adding more agents might not fix this and we might have to fix the routing logic.
Next: From an EDA perspective, we seem to have strong evidence but let’s ground it in some statistical evidence. We will use formal tests to quantify the operational changes’ causal impact on SLA.